Managing Clients on the Clients page
The Clients page provides access to detailed information for each of your client's for which Datto Saas Defense has been activated. Information includes the date you activated SaaS Defense for the client, the number of malicious attacks (if any) attempted on the client's Microsoft 365 services, and the number of seats protected for each of those services. Client management tools on this page allow you to perform the following:
- Review seat information for each client's activated Microsoft 365 services (see the article Accessing service seat information).
- Choose whether Datto SaaS Defense automatically blocks incoming threats or only flags threats allowing you to investigate further (see the article Changing the SaaS Defense operating mode).
- Configure email allowlists that automatically permit access to incoming emails based on criteria (i.e., sender's email address) you specify (see the article Configuring email and URL rules).
- Configure URL allowlists and blocklists that automatically permit or restrict access to content that includes website addresses you specify (see the article Configuring email and URL rules).
Clients page
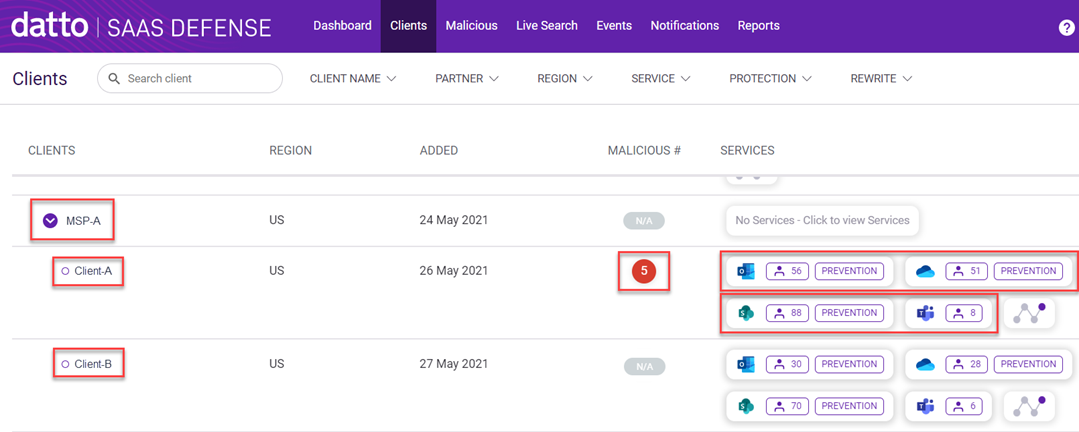
The information provided for each client on the Clients page is described in the table below.
| Column | Description |
|---|---|
| Clients | The name of the MSP is listed at the top level. Each client is listed at the second-level. |
| Region | The region in which the client is located. Values are US, Canada, Germany, UK, and Australia. |
| Added | The date on which Datto SaaS Defense was activated for the client. |
| Malicious # | The total number of scans performed that detected a malicious threat (number does not include spam detections). The number displayed is a link to the malicious page, providing access to the threat attempt records for only the client whose number is clicked. |
| Services | The seat count for each of the Microsoft 365 services for each client. Each service tile provides access to the list of specific addresses/entities protected.. |
EXAMPLE In this Client page example, MSP-A has two clients, Client-A and Client-B. Looking at the Malicious # column for Client-A, you can see there were five scans that detected a malicious threat. The Services column shows the number of seats protected for each of Client-A's services (as in, 56 seats protected for Exchange 365, 51 seats protected for OneDrive, and so on).
Clients page toolbar
The Clients page automatically displays information for all of your clients. The Clients page toolbar allows you to select filtering options to display only the client records that match the options you select. For more information about filtering results, see the article Filtering page results.
Search box
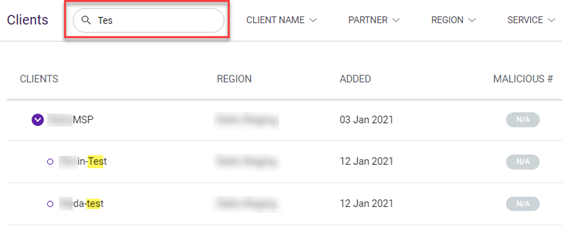
You can search for a specific client by entering the client's name in the search box, which is not case-sensitive. As you enter text in the search box, the page results begin to filter based on the Client field.
Filters
The following table describes each filter on the Clients page:
| Filter | Description |
|---|---|
| Client Name | Lists the names of each of your clients. |
| Partner | Lists the names of each of your partners. |
| Region | Lists the regions for which your clients are possibly located. |
| Service | Lists each of the Microsoft 365 services. |
| Protection | Lists Prevention and Detection as filtering options. |
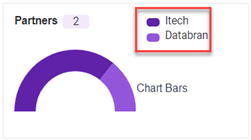
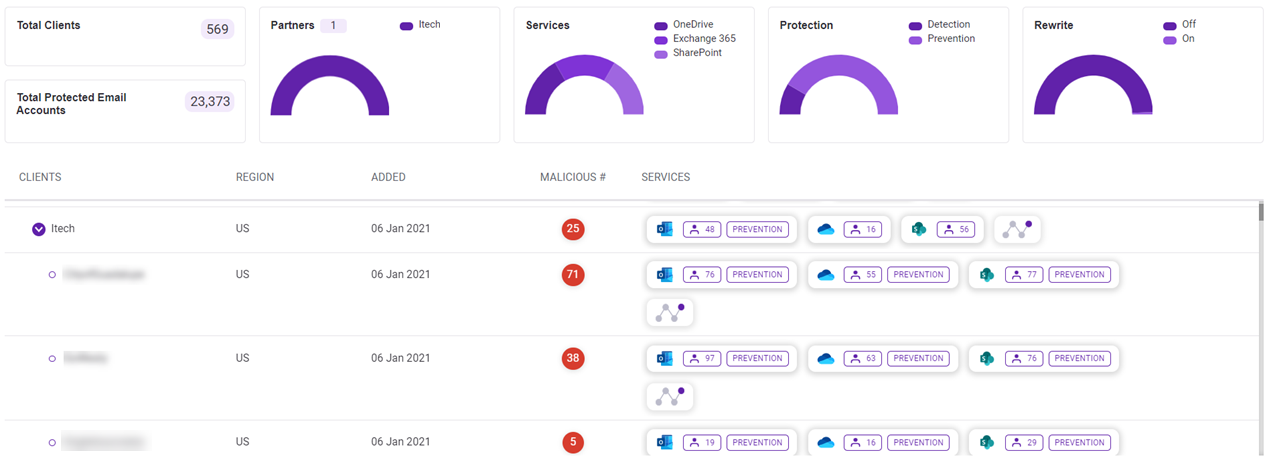
The charts on the Clients page provide a graphical representation of your environment data. In this example, the Partner menu was filtered to display data for only Itech and Databran.
You can filter the results further by clicking an item in the legend or by clicking the corresponding bar in the chart.
In this example, only the data for Itech is displayed.
To view chart information:
- At the end of the Clients menu toolbar, click the Show Charts icon.

- To filter the chart data, click an item in the legend or its corresponding chart bar.
- To display the unfiltered chart data again, click Clear Filters.

NOTE Filtering chart data also filters the data displayed on the Clients page.
The Malicious page is quickly accessible for each client for which a number is displayed in the Malicious # column. The number displayed indicates the number of scans performed that detected a malicious threat. In this example, you can see in the Malicious # column that five malicious threats were detected on Client-A's services.
Clicking the number in the Malicious # column displays threat information on the Malicious page for only the client (Client-A in this example) whose number was clicked.
NOTE The number in the Malicious # column corresponds to the number of scan records that are accessible on the Malicious page for the applicable client. However, on the Malicious page, you can group scan records based on a common value, such as Name or Region (per View Mode. Doing so lists the grouped records together as one record. The Scans column lists the number of scan records within the grouped record. In this example, the Scans column shows that the third record includes three scans grouped together based on the Name value (as selected in View Mode). This most likely indicates the same threat was involved in each scan. You can click the grouped record to access each scan individually. 


